
Performance Testing
Guides for authoring, running and analysing tests across web automation, API and performance — plus setup, collaboration and release notes.
Periodic Metrics
Periodic metrics are time-based snapshots of performance data collected during a single test run. They show how response time, errors, samples, and (for API) throughput change over the course of that execution — not across different runs. You view them on Performance → Test Results → run detail, in the chart sections below the summary cards and Aggregate Report.
What they are
Each interval stores a timestamped snapshot per API step or web action, plus a TOTAL row. Together they form a time series for that run — so you can see when response time, errors, or throughput shifted (for example during ramp-up or near the end), not just the final aggregate numbers.
Periodic metrics vs Aggregate Report
| Concept | Periodic metrics | Aggregate Report |
|---|---|---|
| Scope | One run, over time | One run, end-to-end totals |
| View | Line charts over time | Summary table |
| Purpose | See when performance changed | See final overall numbers |
Note:
Periodic metrics are not the same as — baseline marks a reference run across executions; periodic metrics trend within a single execution.
View periodic metrics — workflow
- Go to Performance > Test Results and open a run row (for example a completed API run).
- At the top, read run metadata and summary cards, then review the Aggregate Report for final per-step totals.
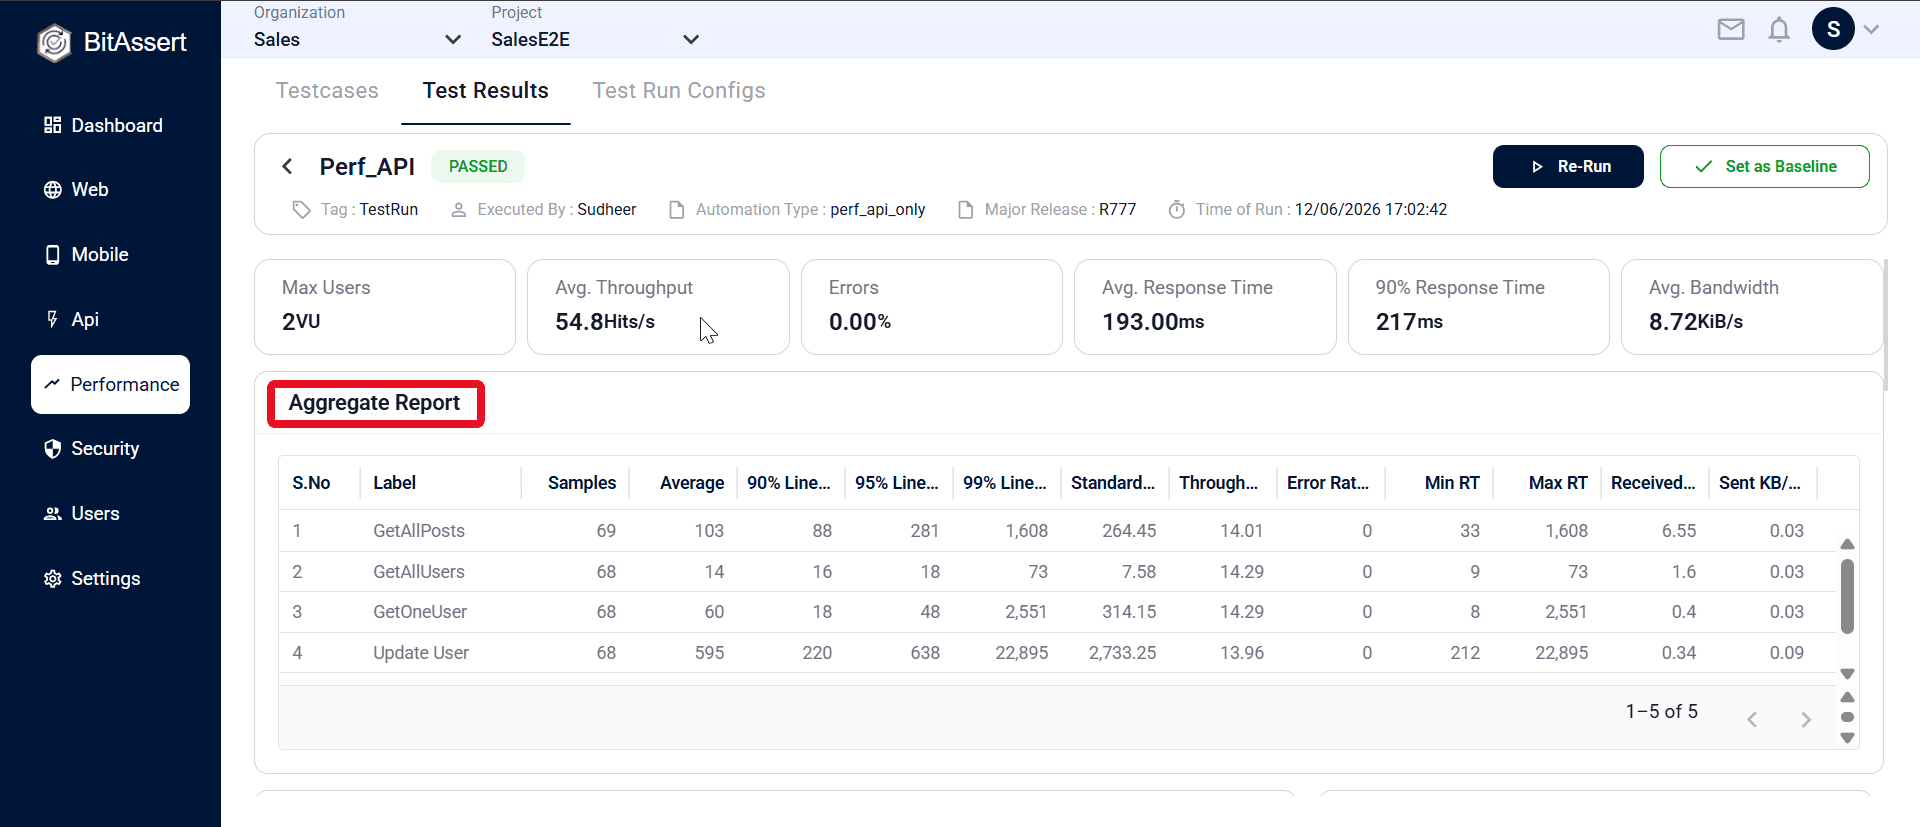
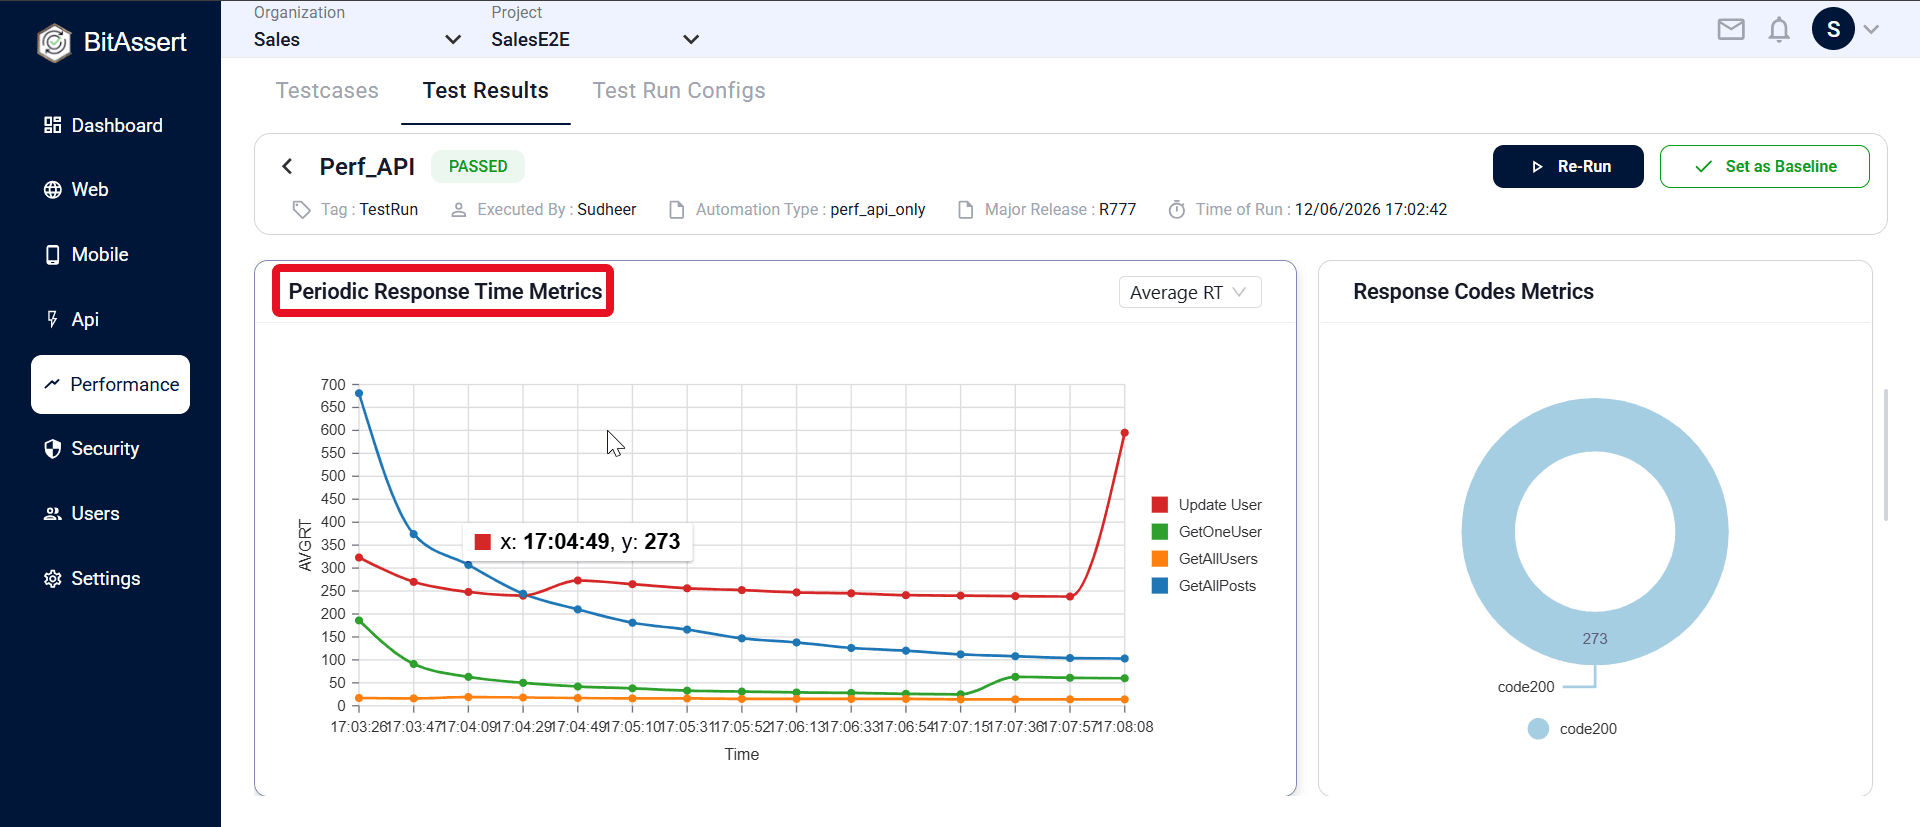
- Scroll to Periodic Response Time Metrics. Use the metric dropdown (for example Average RT) and click legend lines to isolate a step. Review Response Codes Metrics beside the chart.
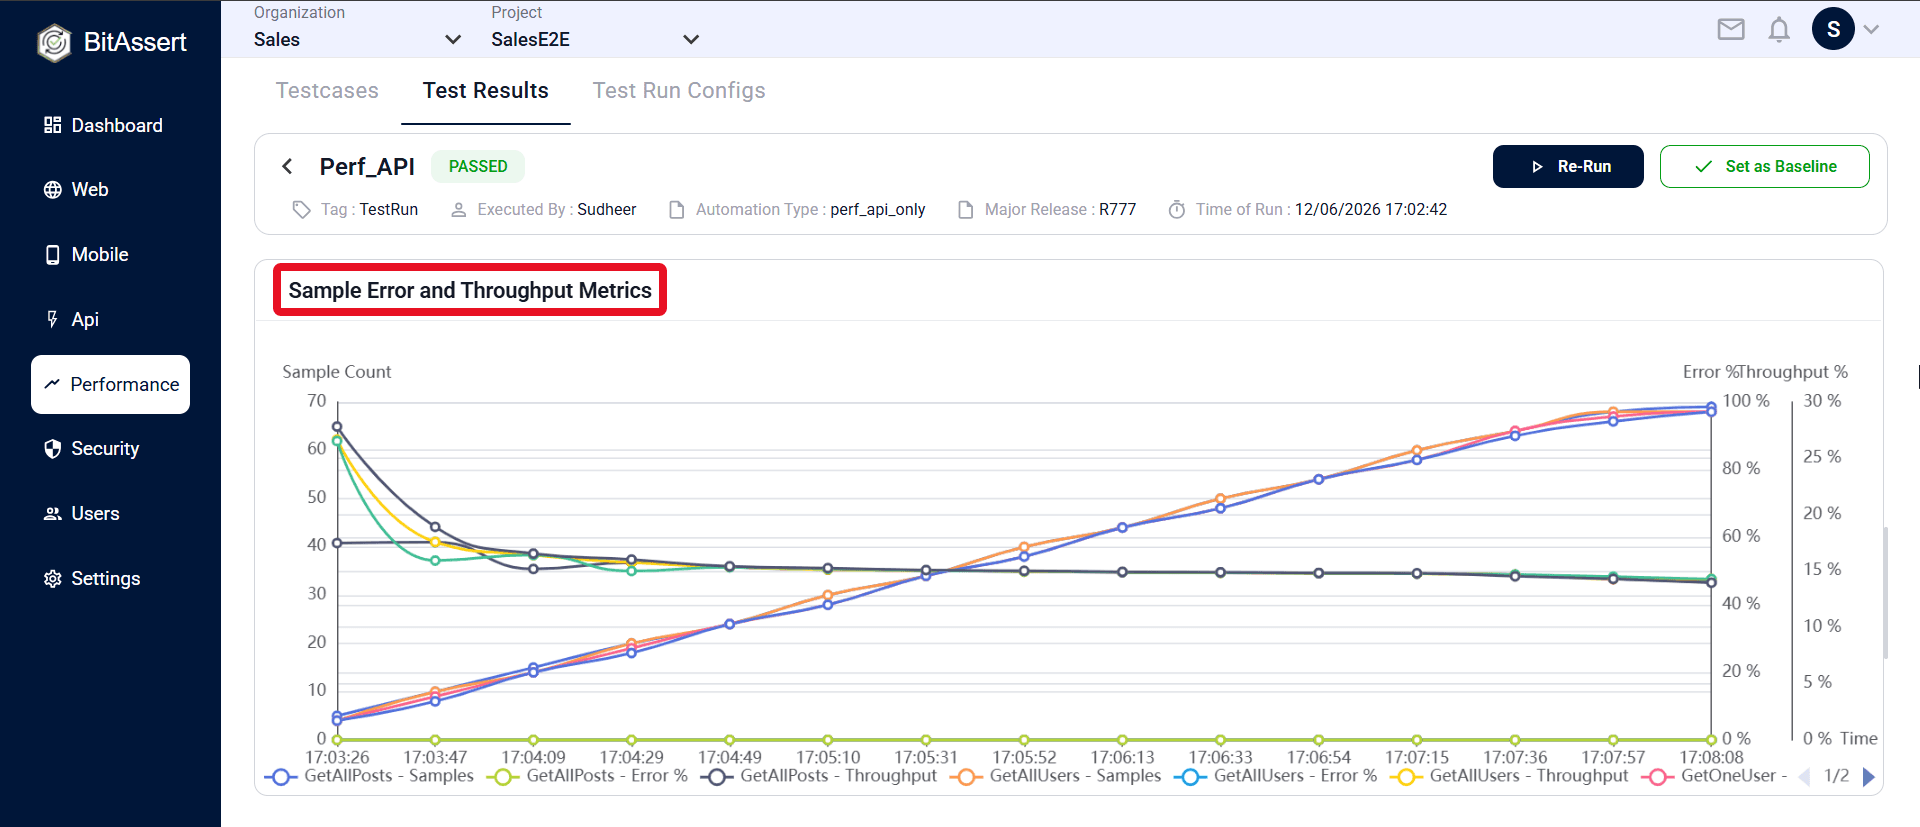
- Review Sample Error and Throughput Metrics — sample count, error %, and throughput per API step over time.
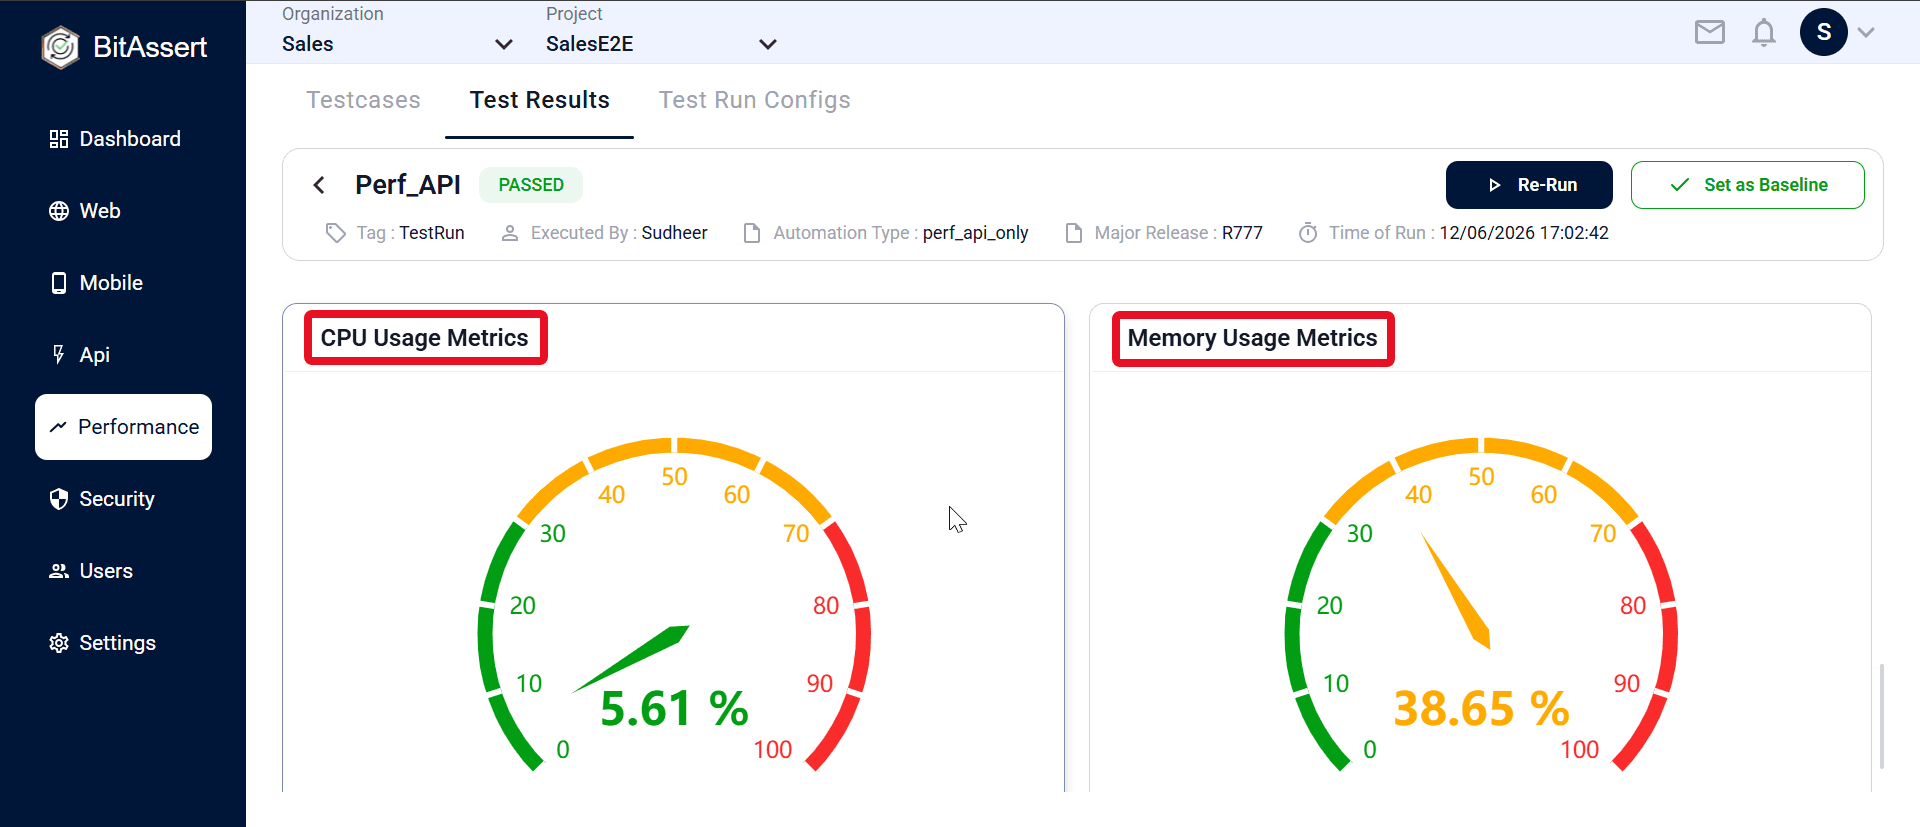
- Scroll further to CPU Usage Metrics and Memory Usage Metrics gauge charts for resource consumption during the run.
Metrics captured per snapshot
API (per step label)
Samples (total/success/failure), average/min/max response time, P90/P95/P99 line RT, standard deviation, throughput (RPM), error rate %, received/sent KB per second, and response code counts.
Web (per action)
Action name, step name, samples, response times, percentiles, error rate %, and error type counts.
Live vs completed runs
| Run state | Behavior |
|---|---|
| IN_PROGRESS / STOPPING | Charts update live as new periodic snapshots arrive |
| COMPLETED / ABORTED | Full periodic history loaded from the server; charts show the complete run timeline |
Summary cards and the Aggregate Report use final aggregated values when the run is finished. Periodic charts always show the progression through the run.
Example
During a 10-minute load test, periodic charts may show response time rise at minute 2 (ramp-up), flatten at minutes 3–8, then spike at minute 9 when errors increase — patterns the single aggregate total alone would not reveal.
How this fits with other views
- Periodic metrics → trends within one run over time
- Aggregate Report → final per-step totals for that run
- Baseline → which passed run is the reference standard for a release (see )
- Test Results list → history of separate runs, not a built-in cross-run trend chart (see )
Expected outcome
You can open a performance run detail page and read how response time, errors, samples, and throughput evolved during that execution. Periodic charts answer what happened when inside a single run; the Aggregate Report answers what the final totals were.