
Three modules. One go / no-go answer.
Web Automation, API Testing and Performance Testing in one organization and project — rolled up into a release-readiness score, with every team isolated from the next.
Module
Web Automation
Browser tests in hours, not sprints.
Record a flow, build it step by step, or describe it in plain English. Reuse elements, step groups and data across every test, then run locally with live results or on Bitassert Cloud across browsers.
How teams author
- Record, manual or AI-driven authoring
- Low-code platform and VS Code extension
- English-language prompts from requirements docs, MCP, product code or an existing test framework
Reuse
- Elements and step groups
- Test data — user-defined, random and runtime
How they run
- Local Agent — live pass / fail while you build
- Bitassert Cloud — screenshots, metrics, bug report and re-run
AI agents
- Test case authoring
- Self-healing
- Exploratory testing
Module
API Testing
Validate services the same way you validate the UI.
Import what you already have, chain requests end to end with data passed between them, and let AI propose the assertions from the real response.
How teams author
- Manual request builder
- Import Postman collections and OpenAPI / Swagger specs
- Every common auth type supported
- End-to-end tests with data passed between requests
Reuse
- Elements and step groups
- Test data — user-defined, random and runtime
How they run
- Local Agent — live pass / fail while you build
- Bitassert Cloud — screenshots, metrics, bug report and re-run
AI agents
- Validations suggested by AI from the API response
Module
Performance Testing
Load-test the tests you already have.
Point a load profile at a Web or API test case you have already written — or a JMeter plan — and compare every run against the release baseline. No load scripts to rebuild.
No rebuild of load scripts. Periodic charts show when it slowed, the aggregate report is the total, and the baseline is the gold standard for that release.
Flow
An existing Web or API test case, or a JMX plan
Load
Users, duration, ramp up and ramp down
Run
On Bitassert Cloud — no Local Agent needed
Prove
Metrics and baseline versus the last release
What you measure
- Response time
- Average, min and max, plus P90 · P95 · P99
- Throughput
- Requests per minute, errors, samples and response codes
- System health
- CPU and memory gauges, with live charts while it runs
- Reports
- Periodic charts, aggregate report, PDF export and baseline trends
AI agents
- AI results analyser writes the executive summary
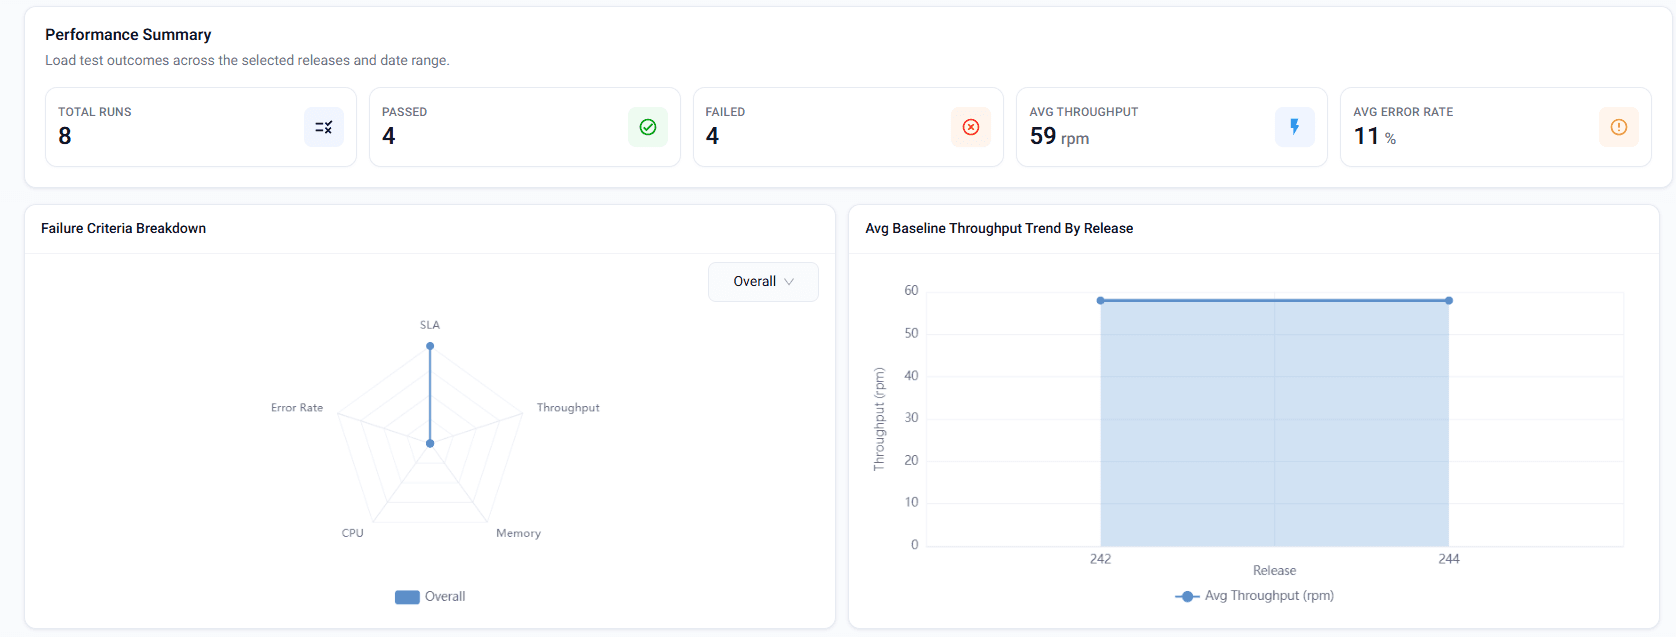
Know if the release is ready — before you ship.
Organization → Project → Dashboard. The All tab shows coverage and run health; Web, API and Performance each answer the same question for their module — Performance under load, against the baseline.
Green Ready means ship. Orange Needs review means explain the failures first. Filter by release for the go-live in front of you.
Each team member sees only their tests, results and readiness.
Access is invite-based at both the organization and the project level, with roles at each: Standard, Manager or Administrator for the organization; Read only or Read / Write for the project. Test cases, elements, data, run configs, results, dashboard metrics and licenses stay isolated end to end.
Switch context, not a bug
If tests or results look missing, the member is in a different organization or project. They only see assets for teams they were invited to.
Account
Tenant boundary
Organization
Team workspace
Project
Tests · runs · dashboard
Start with the module that hurts most.
Web, API and Performance are licensed separately — compare the Standard and Enterprise plans, or talk to us about your rollout.